Master Scan
Every scanner in one table — one row per stock, one column per setup, so a whole watchlist reads at a glance instead of tab by tab.
MarktMakrs is a fast, no-clutter dashboard over NSE market data. It scans your stock universe for the conditions you care about — crossovers, momentum shifts, breakouts, structure — and puts a chart one click from every result.
7-day free trial, no card needed. Nothing to install, and no broker account to connect.
MarktMakrs provides technical-analysis tools only. Scan results are the output of formulas applied to market data, not recommendations to buy, sell or hold. We are not SEBI-registered investment advisers or research analysts, and nothing here is investment advice.
Eleven scanners, one universe selector, and a chart that carries the same indicators the scan ran on.
Every scanner in one table — one row per stock, one column per setup, so a whole watchlist reads at a glance instead of tab by tab.
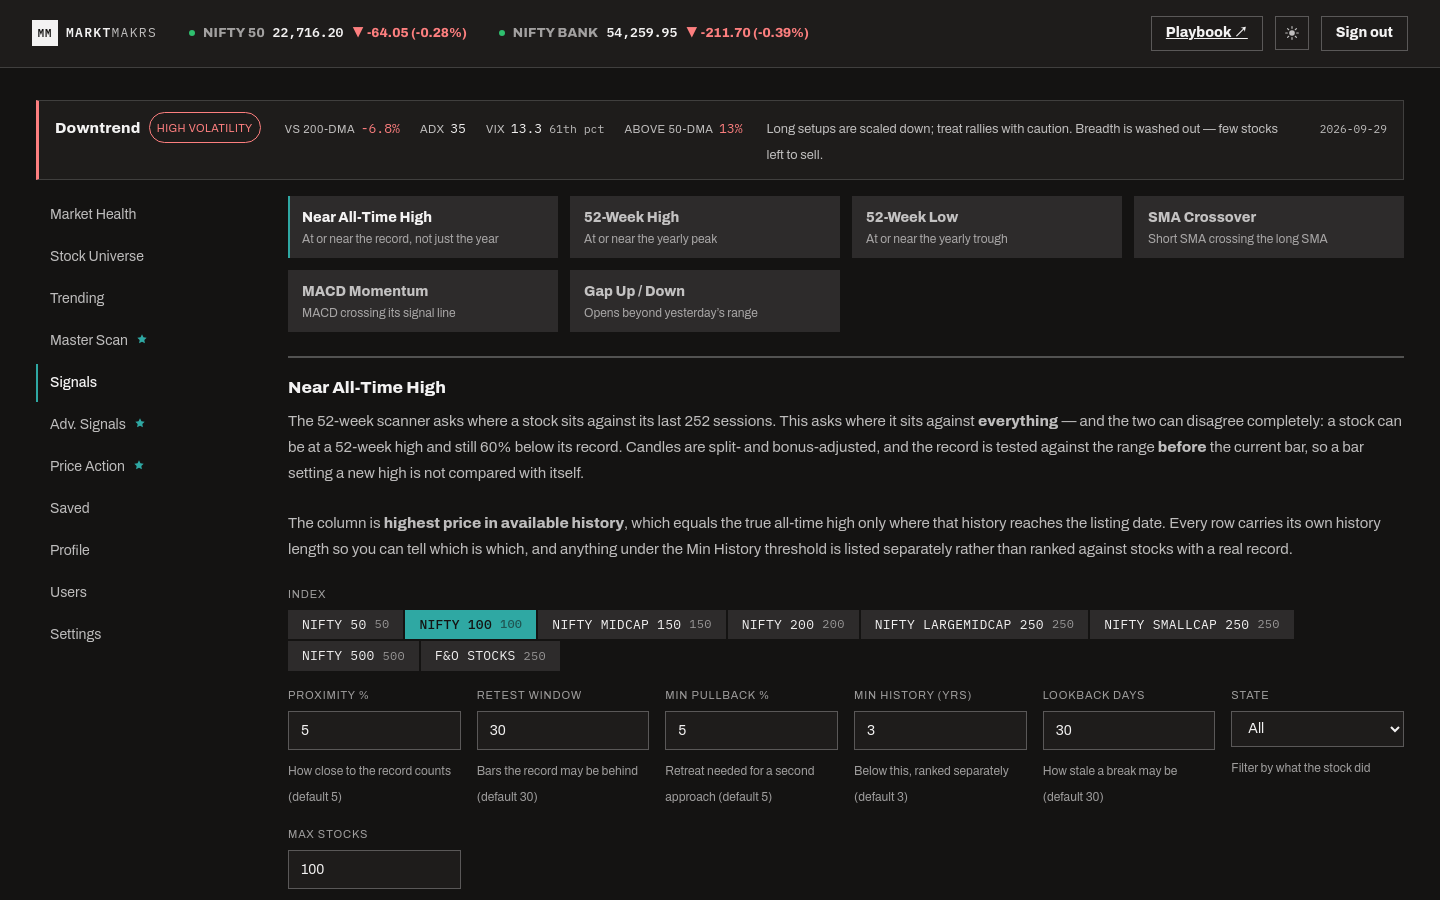
SMA crossovers, MACD against its signal line, EMA slope and curvature, and 52-week highs and lows across the universe you pick.
Range breakouts, gaps, candle reversals with context, double tops and bottoms, flags and pennants, and clustered support and resistance.
Higher highs and lower lows with a conviction read, plus volatility contraction, so you can tell a real trend from a drifting one.
Open any symbol in a candlestick chart with the same indicators and pivots the scan used, so a signal can be checked, not just trusted.
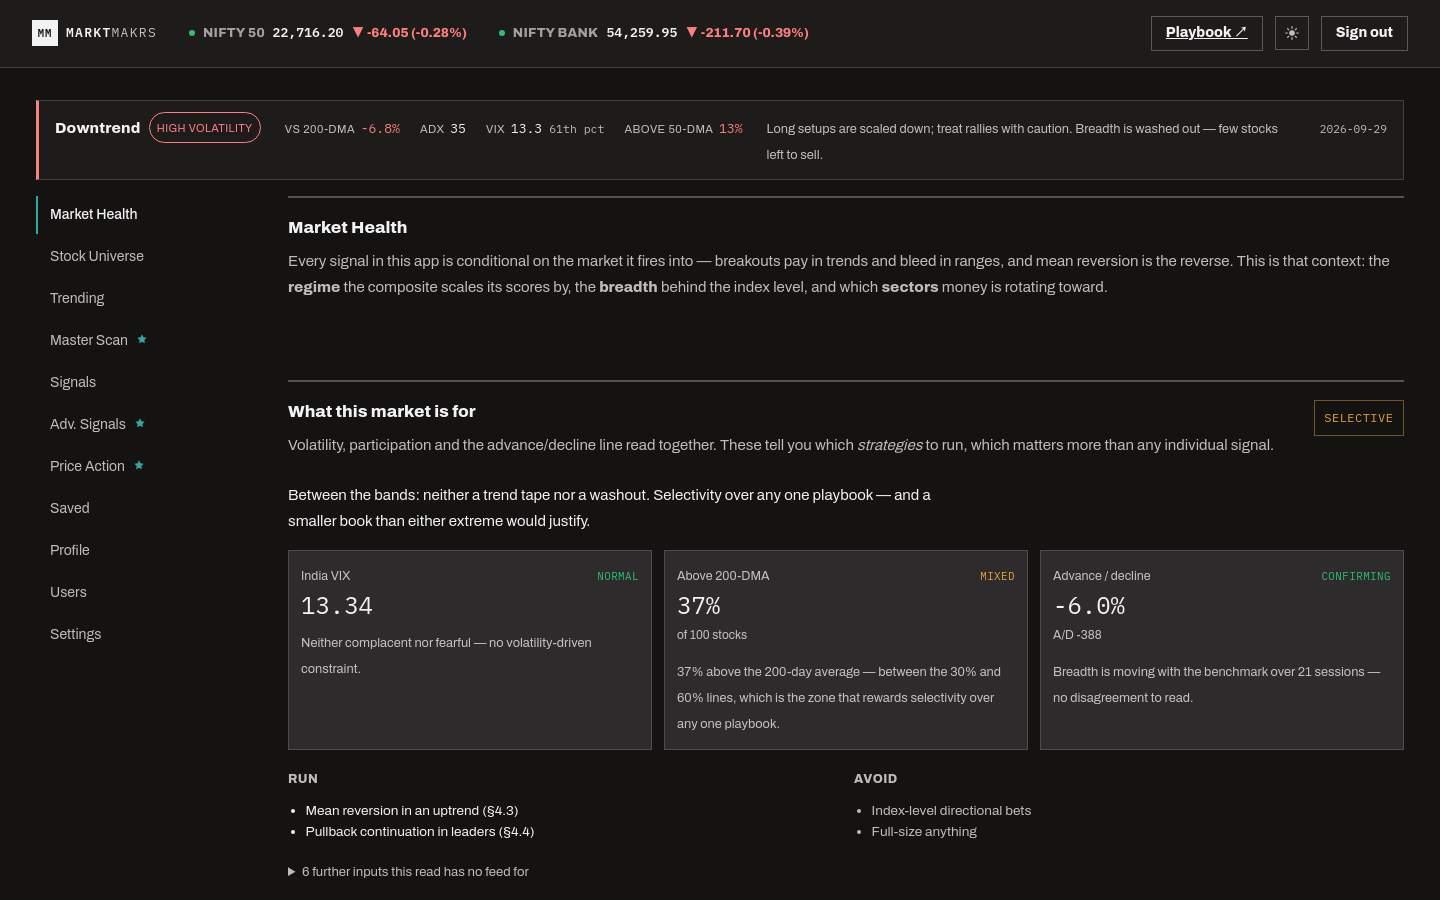
Index ticker and relative strength alongside the scans — a breakout means something different when the index is doing the same thing.
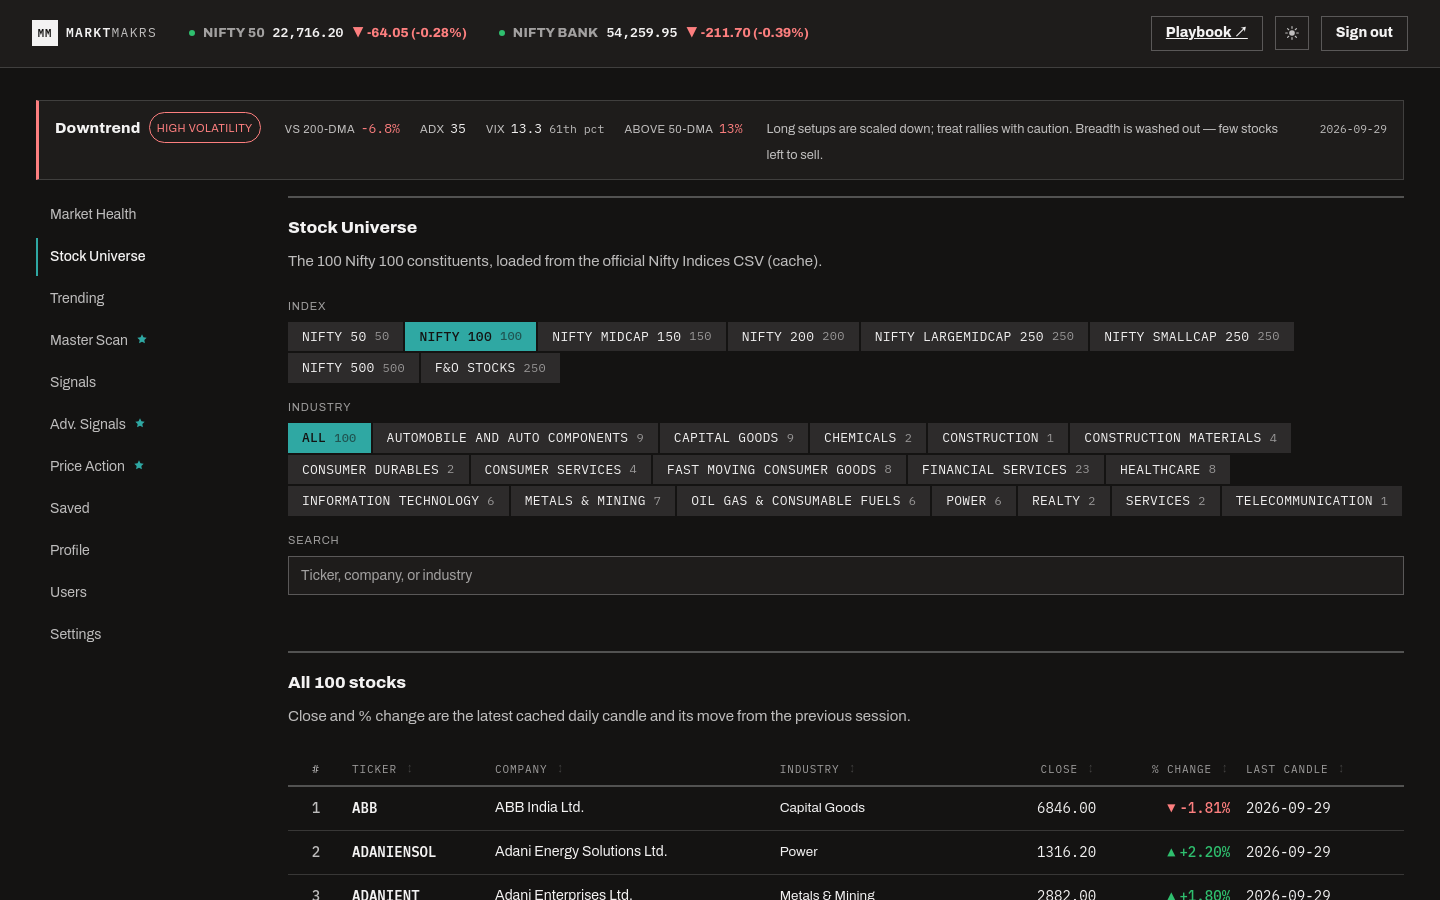
The dashboard as it runs. Market data in these captures is from the session they were taken in, not live.
Continue with Google — first sign-in creates your account — and you land straight on the dashboard. No registration form, no setup screen in between.
Pick an index or an industry and run the scanners across it. Market data is already connected server-side — there is nothing for you to set up or link.
Work down the table: open any row on a chart to see the conditions that matched, with the same indicators and pivots the scan used.